Astronomers have created the clearest 'age map' of the Milky Way, after identifying the ages of over 130,000 different stars.
Maps like these can help researchers understand how our galaxy and everything in it grew through the accretion of stars and gases over the course of 13.5 billion years.
"We haven't previously known much about the age of the most ancient component of the Milky Way, which is the Halo System," said one of the team, Daniela Carollo, from the University of Notre Dame.
"But now we have demonstrated conclusively for the first time that ancient stars are in the centre of the galaxy and the younger stars are found at longer distances. This is another piece of information that we can use to understand the assembly process of the galaxy, and how galaxies in general formed."
To create the detailed map, the team poured through data gathered by the Sloan Digital Sky Survey, in search of helium-burning 'horizontal-branch stars', which can be aged based on their colour.
"The colours, when the stars are at that stage of their evolution, are directly related to the amount of time that star has been alive, so we can estimate the age," said team member Timothy Beers.
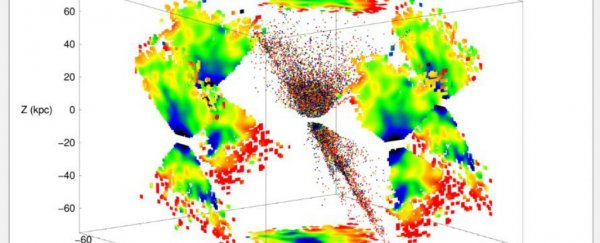
In the end, the team found over 130,000 of these stars in the Milky Way and were able to plot them on a three-dimensional map that shows that older stars are more likely to be in the centre of the galaxy with younger stars on the outskirts.
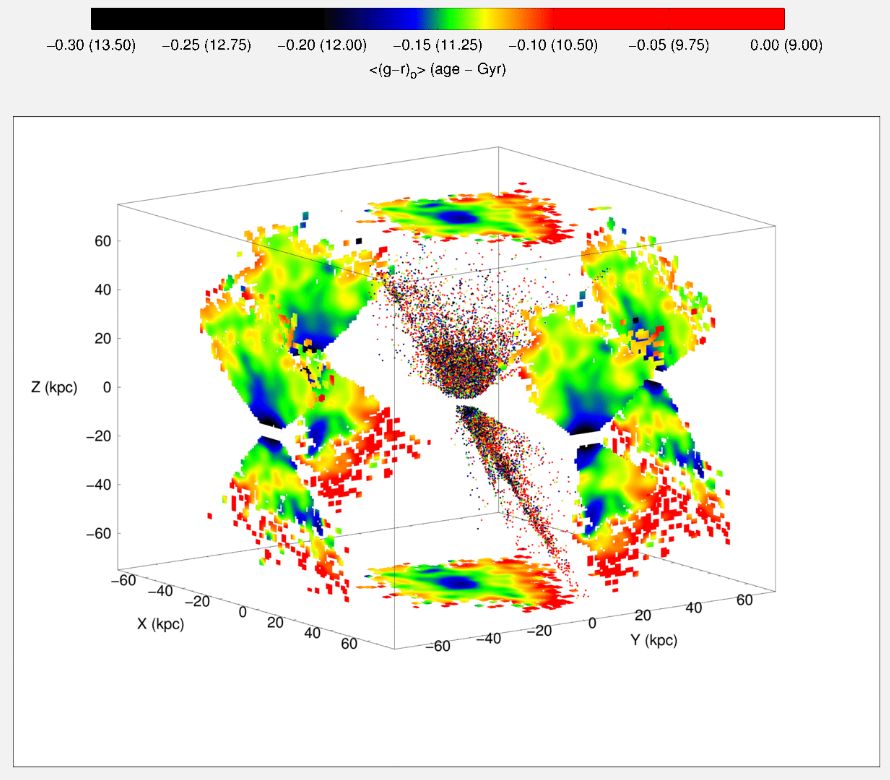 University of Notre Dame
"Once you have a map, then you can determine which stars came in first and the ages of those portions of the galaxy," Beers said.
"We can now actually visualise how our galaxy was built up and inspect the stellar debris from some of the other small galaxies being destroyed by their interaction with ours during its assembly."
The findings offer a timeline of the Milky Way's formation. First, gas clouds of hydrogen and helium formed initial stars. Then, as the gravitational pull of these initial stars started to pull in more and more dust, the galaxy grew larger and larger.
As time went on, more and more stars and dust clouds were pulled in, eventually combining into large structures.
The team now hopes to use their mapping system on other galaxies, using data collected by the upcoming James Webb Telescope that NASA plans to launch by 2018.
Their findings have been published in Nature Physics.
This isn't the first time researchers have developed a map to help understand the Universe. Back in July, an international team of astronomers created a 3D map that shows the position of 1.2 million different galaxies - a project that took five years to complete.
Here's what that map looked like:
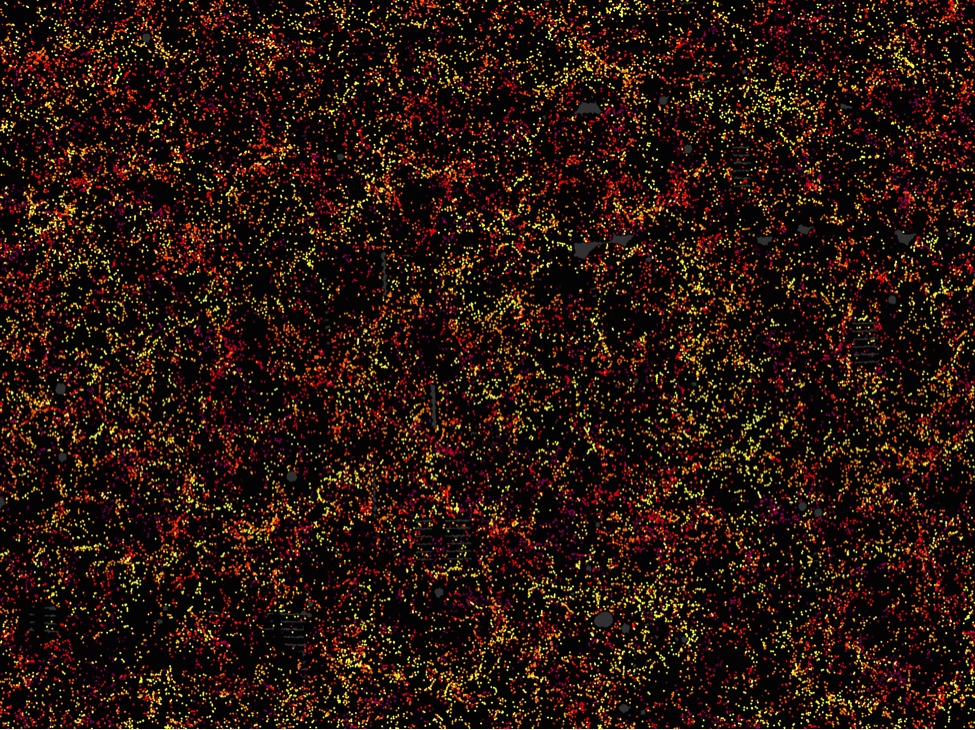 Daniel Eisenstein and SDSS-III