We're heading into a solar minimum, the period of the least sunspot activity in our Sun's roughly 11-year cycle. But despite that, in September this year the Sun erupted into massive activity.
From one single active sunspot region our home star belched out more than 30 solar flares, including the biggest one we've seen since 2005. And now we have new images of what that insane activity looked like from space.
Lucky for us, the NOAA, NASA, JAXA, the ESA and others had many eyes trained on the old treacle bun, tracking the active region AR 2673 as it moved across the surface of the Sun, facing towards Earth.
Different space-based observatories are set up to study the Sun at different wavelengths, to capture as much information about its activity as possible.
"With multiple views of solar activity, scientists can better track the evolution and propagation of solar eruptions, with the goal of improving our understanding of space weather," wrote Lina Tran of NASA's Goddard Space Flight Center.
"Harmful radiation from a flare cannot pass through Earth's atmosphere to physically affect humans on the ground, however - when intense enough - they can disturb the atmosphere in the layer where GPS and communications signals travel.
"On the other hand, depending on the direction they're traveling in, CMEs can spark powerful geomagnetic storms in Earth's magnetic field."
Different wavelengths can reveal unique structures and dynamics around solar flares, as well as the surface of the Sun itself.
Most solar observatories are set up to take observations in several wavelengths, all of which are measured in Angstroms. Here's what some of that looks like.
Below, NASA's Solar Dynamics Observatory images the corona in 10 wavelengths for a wide range of data. This timelapse is of the X9.3 event. The footage might look staticky - that's caused by solar particles hitting the instrument.
 NASA/GSFC/SDO
NOAA's Geostationary Operational Environmental Satellite-16 images the corona in 6 wavelengths. This is footage of the X9.3 flare:
 NOAA/GOES
This sequence from NASA and JAXA's Hinode isn't in visible light, but X-rays. It shows the X8.2 flare that erupted on 10 September, 2017:
 JAXA/NASA/Hinode/SAO/MSU/Joy Ng
This series from NASA's Solar and Terrestrial Relations Observatory shows two coronal mass ejections, or CMEs, the first from 9 September, and the second from 10 September, associated with the X8.2 flare and travelling at speeds as high as 11.2 million kph (7 million mph). It's one of the fastest ever recorded.
 NASA/GSFC/STEREO/Joy Ng
CMEs are distinct from flares, and are made up of the magnetised particles that the sun hurls into space. They are very hot, and can best be imaged with a coronagraph, which has a metal disc, called an occulting disc, that blocks out the light from the sun.
With NASA and the ESA's Solar and Heliospheric Observatory's sequence of the 9 and 10 September CMEs, you can see more snow-like static caused by solar particles:
 ESA/NASA/SOHO/Joy Ng
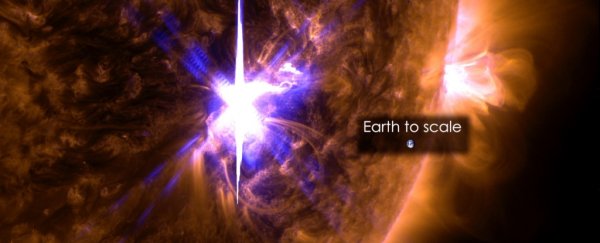
NASA's Interface Region Imaging Spectrometer takes images from several wavelengths between 1,332 and 2,834 Angstroms to capture the lower level of the sun's atmosphere called the interface region. These structures in the image below are associated with the 10 September X8.2 flare:
 NASA/GSFC/LMSAL/Joy Ng
Thank you, space observatories, we love all of this footage so much.
And if you're keen for even more solar flare beauty, you can read more about September's activity over on NASA's website here.