Global warming, deforestation, coral bleaching, urbanisation… the list of ways that we've managed to damage Earth in our time here isn't a pretty one, and a new online map called EarthTime brings all those effects into sharp focus.
You can watch the world change before your eyes between 1984 and 2016 – forests and glaciers disappear, coral gets damaged, and sea levels creep up, mostly thanks to the increased amount of carbon dioxide we're putting into the air.
And the map can look into the future, too. Check out the sea level rise story, which paints a picture of how increases in global temperature could have catastrophic effects on cities and communities close to the coastline.
With just a 2 degrees Celsius (3.6 degrees Fahrenheit) increase in temperature over the next 100 years, waters could be lapping at the edges of Central Park in New York.
The tool has been developed by researchers at Carnegie Mellon University in Pittsburgh since 2015, but has only just been made available on the web for anyone to access. It blends data from research programmes, government agencies, and nongovernmental organisations like the World Economic Forum.
"EarthTime is a means to tell stories," says one of the team, Illah Nourbakhsh. "The impact of humanity can be seen globally and in individual communities – and at every scale in between."
"You really can't understand climate change, migration or major social and political trends without examining their connections across time, across space and between each other. EarthTime enables you to do that."
You can click around the map as you like, using the Data Library drop-down to show layers like coral bleaching or forest loss. For a more detailed trip through the data, check out the options underneath the Stories heading.
For instance, choose the Deforestation option to see how the laying of one road through part of the Amazon rainforest eventually led to vast swathes of the area getting converted into farmland. You can also see the way that forces of trade and industry put pressure on these unspoilt regions.
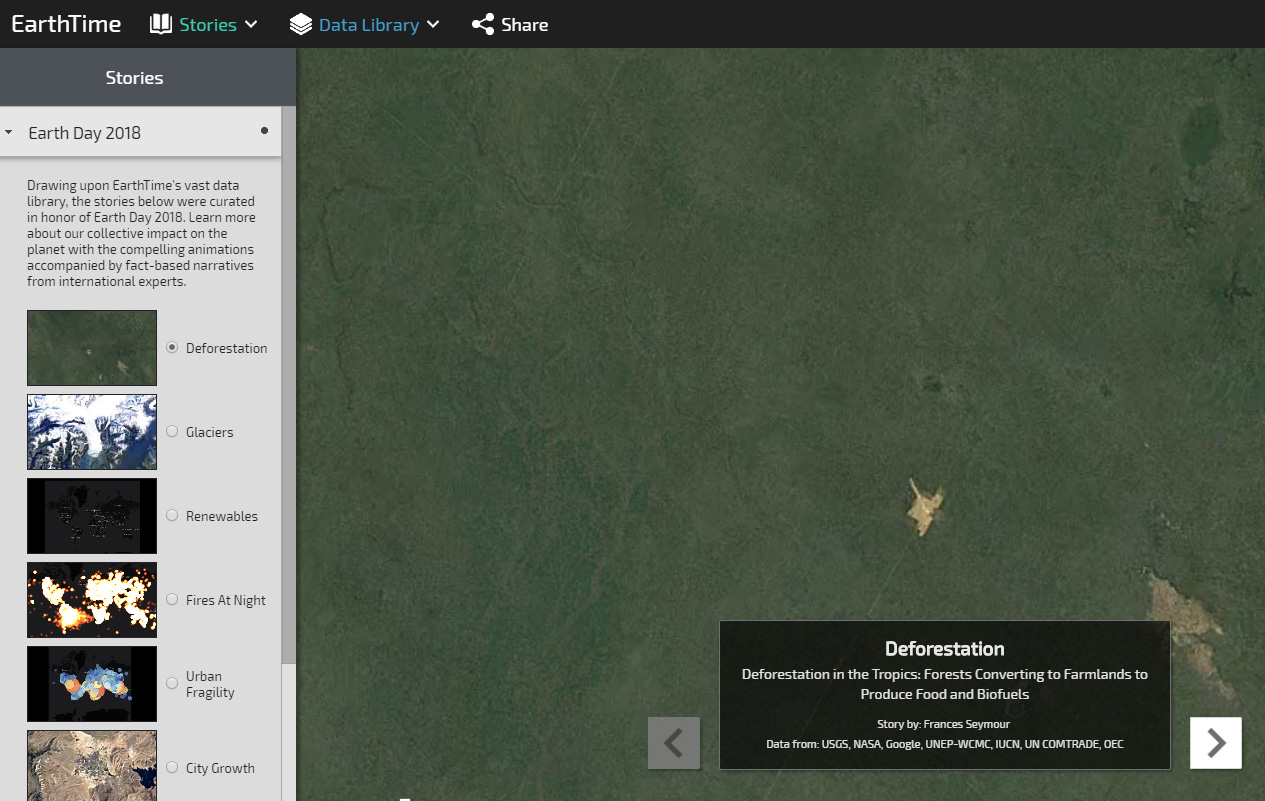 (EarthTime)
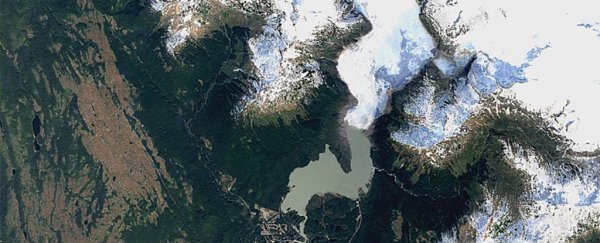
Or try the Glaciers option. Here you get the tale of an acceleration in ice melting and glacier retreat over the last 30 years, with some tracts of ice disappearing right before your eyes.
It's not all depressing, though - there are some good news stories, like the Renewables one. Switch on the Solar PV or Wind Power layers on the map if you want to see the slow but steady spread of these alternative energy sources across the world.
It's one bright spot in what's otherwise a dismal picture – and sometimes visualisations like this are the only way to drive home the message about the harm we're causing. Pass it on to all the friends, family members, and colleagues that you can.
The years 1984 to 2016 might be dramatic and disconcerting as far as the changing face of our planet goes, but much worse is on the way unless we take action.
Climate change expert Michael Mann from the Penn State Earth System Science Center, who isn't involved in EarthTime, says the outlook is a grim one.
"Sea level rise is a profound threat," Mann told Cara Maines at NBC News Mach.
"Globally, as many as 650 million people live on land that will be submerged or exposed to chronic flooding by 2100 given business-as-usual burning of fossil fuels and sea level rise of 6-8 feet."