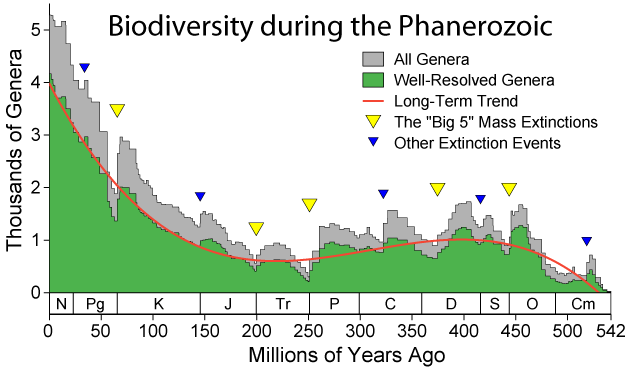
The diversity of life here on Earth is constantly in flux, but this universal pattern of evolution and extinction is not easily explained. Some scientists have reasoned that mass extinction events occur on our planet every 26 to 30 million years and that biodiversity changes every 62 million years.
But the marine fossil record suggests otherwise. Instead of a typical bell-shaped curve, where a rise in biodiversity eventually slips over into extinction and vice versa, the fossil record since the Cambrian period has shown a fat-tailed distribution, where large extreme events are more probable.
 (Ana Marjanović Jeromela)
The unusual pattern has been confusing scientists for years, and now, researchers think they may have solved the mystery.
Their explanation rests on a simple mathematical tool, drawn from the physics of thermodynamics and used by systems scientist Miguel Fuentes to explain something from a totally different field - unpredictable crashes in the stock market.
"In biology, we see these crashes and explosions too, in terms of biodiversity," says environmental scientist Andy Rominger from the Santa Fe Institute.
"We wondered if Fuentes' elegant approach could also describe the evolutionary dynamics we see in the fossil record."
This approach is known as superstatistics, and the authors argue it's a powerful tool for figuring out how fluctuations in local subsystems can impact the bigger picture. In this case, that meant zeroing in on clades, which are groups of organisms that evolved from a common ancestor and usually share long-lasting adaptive traits.
"Within a lineage of closely related organisms, there should be a conserved evolutionary dynamic. Between different lineages, that dynamic can change," explains Rominger.
"It turns out, just invoking that simple idea, with some very simple mathematics, described the patterns in the fossil record very well."
The authors found that while families and orders held onto a normal bell curve, when they zoomed out further to classes and phyla, this unique dynamic equilibrium was thrown out of whack. In other words, when more disparate organisms are added to the mix and classifications become more broad and complex, the less likely it is that one statistic can describe the overall dynamics.
As the different equilibria from orders and families collide, each of which exploits the environment differently and obeys a different set of statistics, you get a characteristically fat-tailed distribution - and that's exactly what the fossil record has thrown up.
"Superstatistics is a powerful tool to derive macroscale predictions from locally fluctuating subsystems whose evolution is driven by interesting, but complex and difficult to model, biological mechanisms," the authors conclude.
"Hence, applications of superstatistics to a wide variety of patterns in ecological and evolutionary systems are ripe for exploration."
If this new explanation holds up to scrutiny from the scientific community, we might finally have a powerful method to help us better understand the processes that drive biodiversity on our planet.
The research has been published in Science Advances.
