A 10-year study conducted by NASA scientists using satellite technology to track pollutants in the atmosphere has shown localised human efforts to improve air quality can have a remarkable impact – as well as revealing areas where emissions have worsened in the past decade.
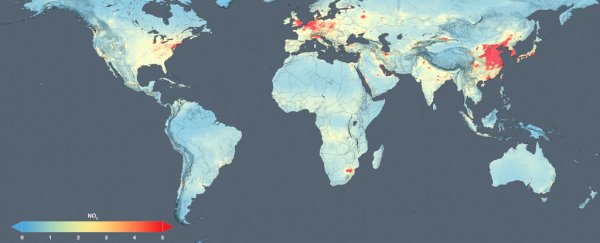
The scientists monitored nitrogen dioxide levels in regions encompassing 195 cities around the globe between 2005 to 2014, creating high-resolution air quality trend maps that highlight which cities and countries are improving their air quality and which ones aren't.
"These changes in air quality patterns aren't random," said Bryan Duncan, an atmospheric scientist at NASA's Goddard Space Flight Centre. "When governments step in and say we're going to build something here or we're going to regulate this pollutant, you see the impact in the data."
Nitrogen dioxide (NO2) is a toxic yellow-brown gas that's emitted from cars and industrial infrastructure such as power plants, largely through the burning of fossil fuels. It contributes to the formation of the smog that hangs over urban environments, which constitutes a major respiratory pollutant.
NASA tracked the emissions using its Aura satellite, which carries a Dutch-Finnish Ozone Monitoring Instrument on board that can detect nitrogen dioxide in addition to other airborne chemicals and pollutants.
The equipment let the scientists see year-to-year movements in nitrogen dioxide levels around the world. To help them make sense of the changing data, they compared the NO2 readings for localised regions with information such as the area's emission control regulations and urban growth.
What's amazing about the trend maps is how quickly the level of the pollutant can change from year to year. In the animation below, you can see nitrogen dioxide rapidly thin in many areas across the US, especially the east coast, between the years 2005 and 2011.
"With the new high-resolution data, we are now able to zoom down to study pollution changes within cities, including from some individual sources, like large power plants," said Duncan.
The findings are reported in the Journal of Geophysical Research.
According to NASA, the US and Europe are among the largest emitters of nitrogen dioxide, but both regions showed dramatic reductions in the period of the study. This was due to tighter environmental controls, with NO2 levels decreasing between 20–50 percent across the US, and by as much as 50 percent in Western Europe. Levels in Japan also fell.
However, regions with fast-growing economies and expanding industry saw increases in nitrogen dioxide levels, with China, India, and the Middle East showing poorer air quality.
China on the whole saw increases of 20–50 percent in nitrogen dioxide, but three of its major metropolitan centres – Beijing, Shanghai, and the Pearl River Delta – saw nitrogen dioxide reductions during the period. By as much as 40 percent, in fact, which the researchers attribute to growing demand in the populace for cleaner air. (Not that you can always tell by looking out your window, sadly.)
Check out this video below from NASA to find out more about this amazing project, and you can find more of the high-resolution maps here: