A new study suggests that we've underestimated the amount of sea level rise that occurred in the Northern Hemisphere during the 20th century, finding that historical records have miscalculated the increase by as much as 5 to 28 percent in certain areas.
By applying the original sea level measurements to a new climate model, researchers found that sea level estimates were based on certain areas that were not indicative of the increases on the globe as a whole, and we're only now seeing the real picture.
The researchers, from NASA's Jet Propulsion Laboratory and the University of Hawai'i at Manoa, say that it's now "highly unlikely" that the global average sea level rose less than 14 centimetres (5.5 inches) during the 20th century, and the most likely amount was closer to 17 cm (6.7 inches).
"It's not that there's something wrong with the instruments or the data, but for a variety of reasons, sea level does not change at the same pace everywhere at the same time," said one of the researchers, Philip Thompson, from the University of Hawai'i at Manoa.
"As it turns out, our best historical sea level records tend to be located where past sea level rise was most likely less than the true global average."
The team found that most of the original readings came from 15 gauges set up in various locations across North America and Europe - but these places just so happen to be where sea level rise appears to have been slower than the global average.
This is because sea level tends to increase faster in areas that are farthest away from the source of melting ice.
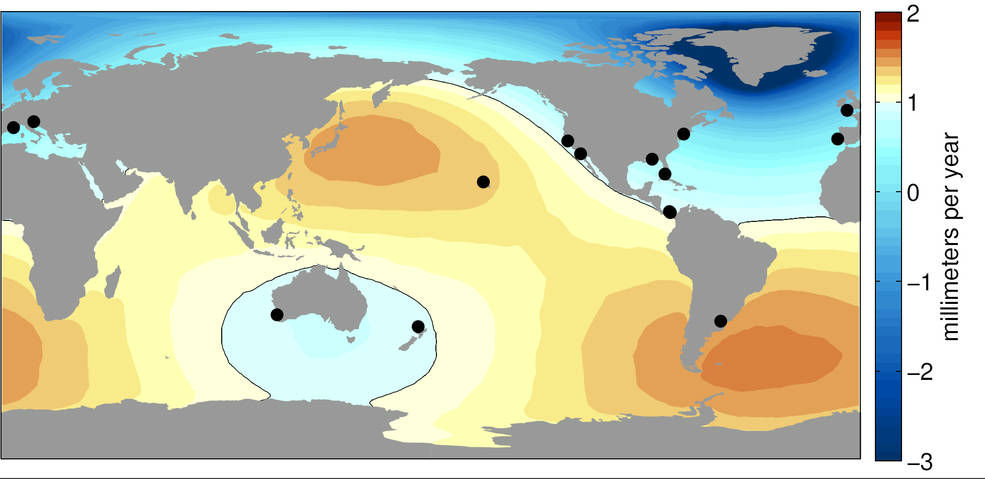 Black dots show locations of our best historical water level records, which underestimate global average sea level rise. Credit: University of Hawaii/NASA-JPL/Caltech
That might seem a little counter-intuitive, but it means if you're on the other side of the globe from where all the ice is melting, your sea levels will rise faster than if you were located right next to the ice melt.
So if you put your gauges in the Northern Hemisphere - where global ice melt has been occurring at a faster rate over the past century than in the Southern hemisphere - your measurements are going to be lower than if you put them in places that are farther away from the melting ice, such as the southern Pacific Ocean and equatorial regions.
"Sea level rise due to the Greenland ice melt, for instance, has been underestimated by 28 percent, the study said, while the sea level drop from the melting Alps was underestimated by 5 percent," Bob Berwyn explains for InsideClimate News.
The researchers also looked at an effect called ice melt fingerprints, which create global patterns of sea level change based on factors such as Earth's rotation and local gravity pressures that occur when a large mass of ice melts into the ocean.
Basically, if you fill a bathtub, the water rises at the same rate to the same height in every corner, but that's not the way it works in the world's oceans, because of Earth's rotation and gravitational force.
If you follow the ice melt fingerprints, you can figure out what's actually going on.
"This is really important, because it is possible that certain melt fingerprints or the influence of wind on ocean circulation might cause us to overestimate past sea level rise," said Thompson, "but these results suggest that is not likely, and allow us to establish the minimum amount of global sea level rose that could have occurred during the last century."
So it looks like we're in a worse situation than we thought, but the good news is that the scientific method is in full force, and at least we now have a better idea of the reality of the situation in the world's oceans.
The research has been published in Geophysical Research Letters.