
A new study highlights worrying differences in life expectancy trends across the United States, showing that states are far from equal when it comes to implementing public health measures and extending the lifespans of the people living within them.
Researchers from institutions in the US and Canada looked at records covering more than 179 million deaths between 1969 and 2020, using a birth cohort approach to the data – so figuring out how long people of each generation lived for. The statistics were extrapolated to cover life expectancy changes between 1900 and 2000.
"Looking at mortality trends by cohort gives us a more accurate reflection of the lived experiences of populations," says Theodore Holford, a biostatistician from the Yale School of Public Health (YSPH).
"It shows the long-term impact of policies and social conditions affecting the life course of populations that might otherwise be invisible in year-by-year comparisons of mortality rates from different generations."
While average life expectancy rose across the board for the years included in this study, there were major discrepancies between locations. For some states, especially in the South, there was little progress across a century of statistics.
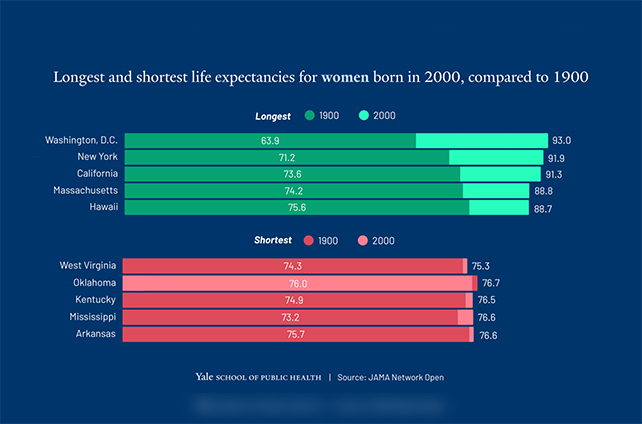
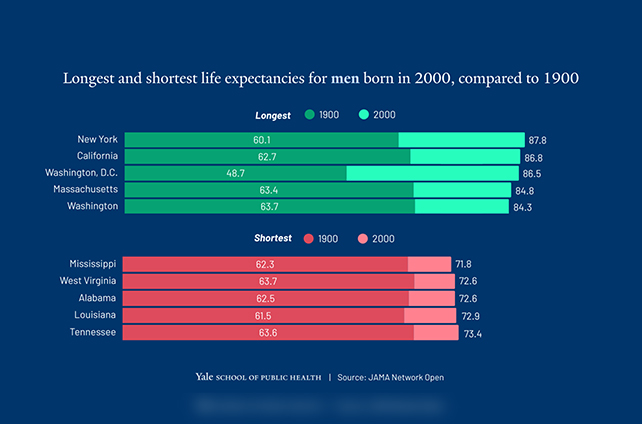
The biggest gains in life expectancy were in the northeastern and western states, and the District of Columbia (DC). In fact, DC showed remarkable improvements: life expectancy rose by 30 years for women and 38 years for men, from the lowest level across any of the states in 1900.
These gaps are indicators of multiple factors, the researchers say, including socioeconomic conditions, access to healthcare, changing (or unchanging) demographics, and policies put in place by local governments.
"For females born in some Southern states, life expectancy increased by less than three years from 1900 to 2000," says Holford.
"That's a staggering contrast when you consider that in states like New York and California, life expectancy rose by more than 20 years over the same period."
There were stark differences too in mortality increases: how quickly your risk of death rises each year after 35. New York, DC, and Florida came out on top here, with Oklahoma, Iowa, and Kansas at the opposite end of the table.
The research team hopes that the study could inform policymakers to tailor interventions that boost life expectancy, such as healthcare access and environmental protections, based on the specific needs of different regions.
Unfortunately, massive cuts to US government funding for healthcare and health research could set that goal back dramatically.
Of course it's very difficult to pick out specific influences on life expectancy from such a broad collection of data, but it's clear that for now, where you live in the US goes a long way to determining how long you live.
"This research highlights the importance of viewing health through a generational lens," says Jamie Tam, a health policy expert at YSPH.
"The benefits of health interventions ripple across lifetimes. A failure to act early and invest in public health harms future generations as well."
The research has been published in JAMA Network Open.