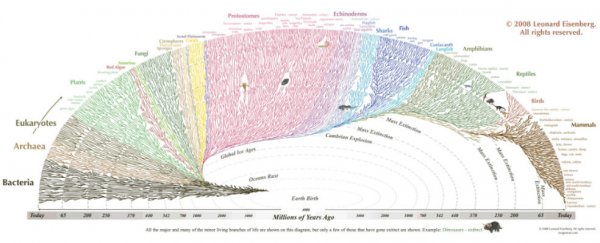
Created as part of a collaboration between the Tree of Life Web Project and designer Leonard Eisenberg, this epic infographic is one monster family tree, showing the history of 3.5 billion years of life on Earth.
Click here for a much larger version, courtesy of Fast Company.
The Tree of Life Web Project aims to collect pictures, text and other information on every species, both living and extinct, with the help of expert and amateur contributors. Here they show how all of life - from plants and fungi to sharks, fish, mammals, and humans - all sprung from the humble bacterium, a creature that has spent billions of years spreading to every corner of the Earth.
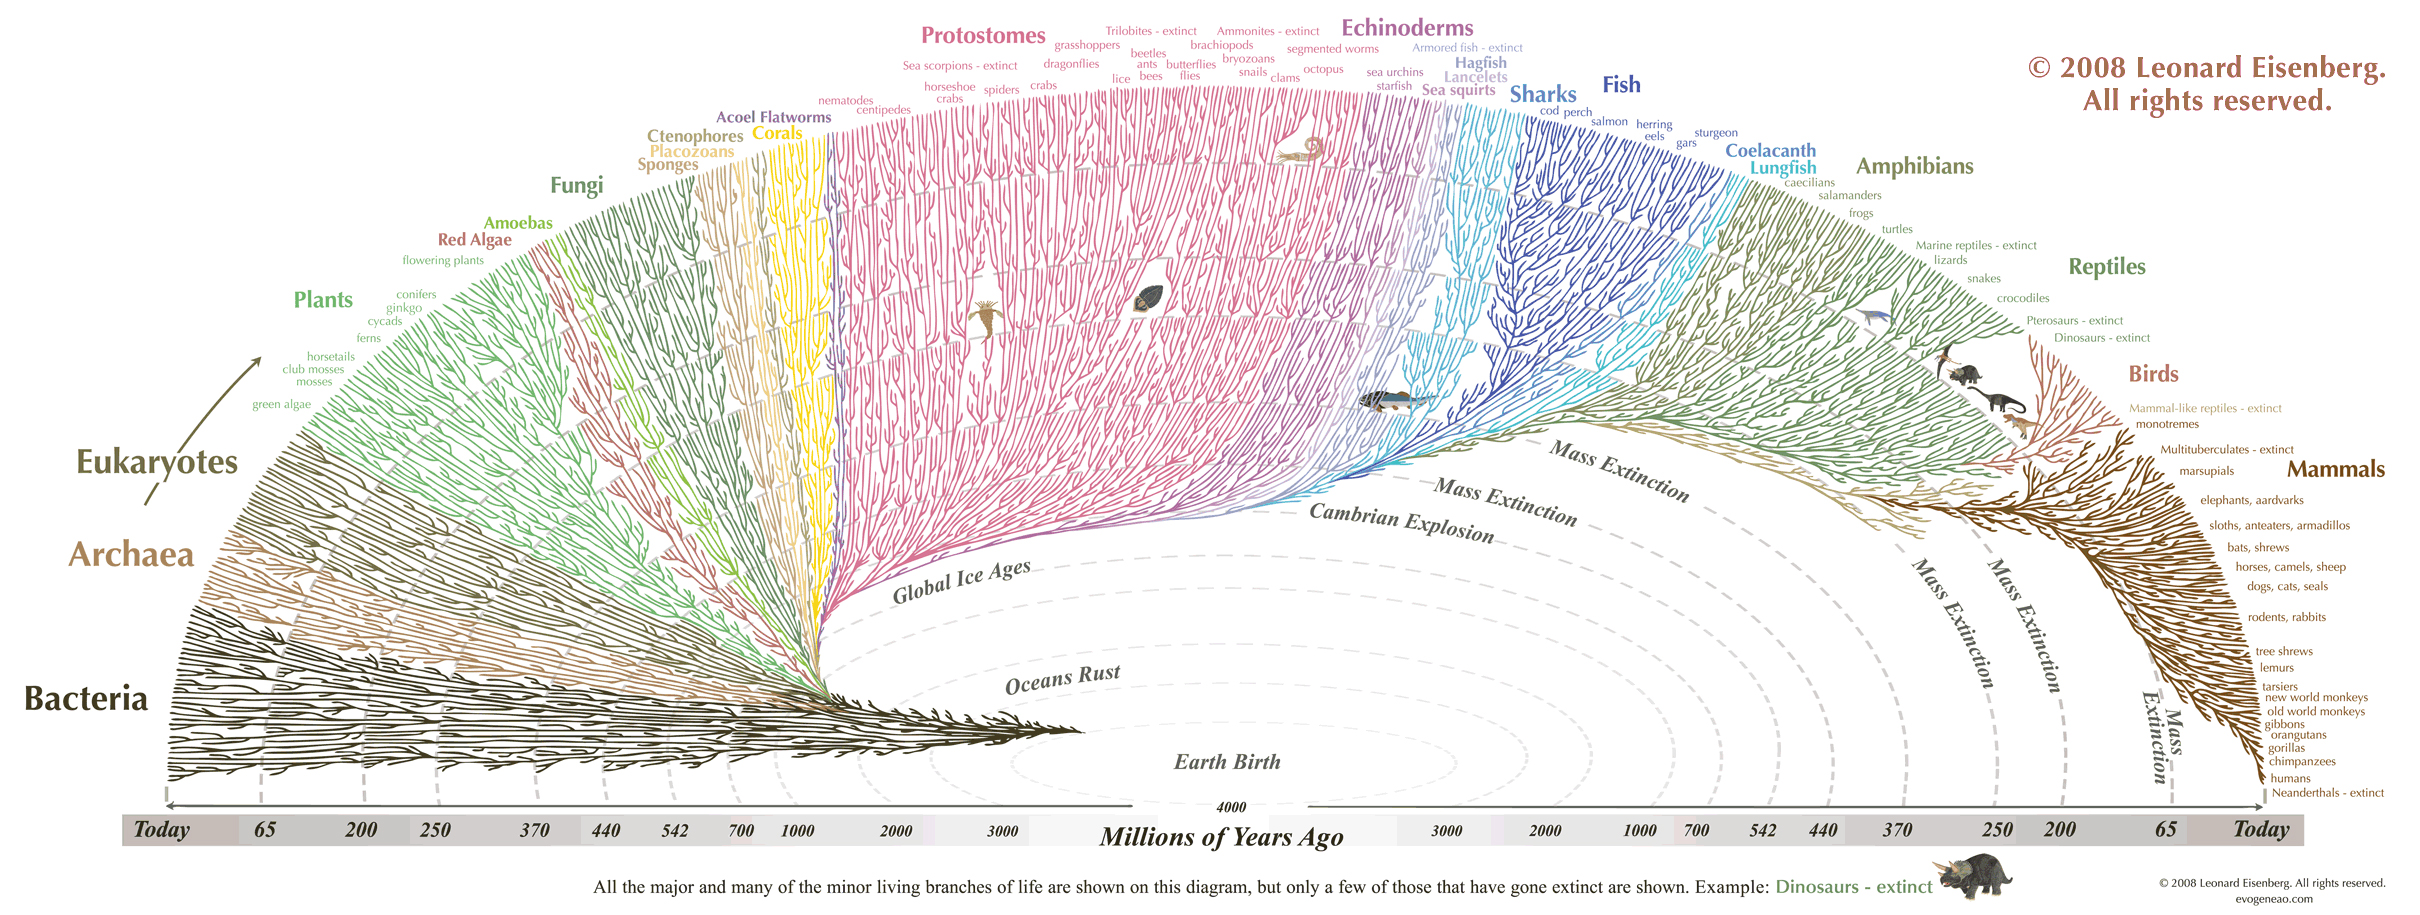
The Tree of Life team says the infographic has been drawn to show all the major - and some of the minor - branches of life tied to a geologic time scale, in the shape of rainbow tree. You can also see how major events of extinction, such as the dinosaurs, have gone extinct, and from there, biodiversity branched out to fill the ecological gaps.
Mark Wilson explains at Fast Company:
"As you look at the graphic, realise that time radiates outward and each kingdom's appearance is also in chronological order from left to right. What you'll discern then is a story of origins and mass extinctions, the way life almost bided its time through the Ice Age then hit the gas through the Cambrian Explosion. It was here when the protostomes (everything from trilobites to squids) simply went nuts, and the separation of plants vs. animals as we know them arose."
Those big white splotches that disrupt various branches throughout the tree represent either extinction events or the end of species whose evolutionary pathway did not lead to further species.
It's a pretty sobering thought that humans, all the way down there in the bottom right-hand corner, have been wiping their way through so many species, particularly in the past half a century.
Source: Fast Company