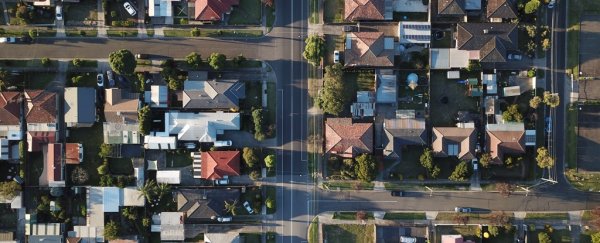
What does your neighbourhood look like? Are there gyms, parks, swimming pools? Or are you surrounded by busy roads, fast food outlets, and convenience stores?
The answer looks increasingly important. Obesity is a complex health issue impacted by a range of factors, one of which is the physical, urban environment we live in. Now, scientists have used artificial intelligence (AI) and satellite images of US cities to map that link – in effect, detecting obesity from space.
"We propose a method for comprehensively assessing the association between adult obesity prevalence and the built environment that involves extracting neighbourhood physical features from high-resolution satellite imagery," the team explains in a new paper.
The researchers, from the University of Washington, fed some 150,000 high-resolution satellite images sourced from Google Maps into a convolutional neural network (CNN) – a kind of AI that uses deep learning to independently analyse and identify patterns within the dataset.
The data covered 1,695 census tracts in six different cities: Bellevue, Seattle, Tacoma, Los Angeles, Memphis, and San Antonio.
The neural network the team used in this case was already pre-trained on approximately 1.2 million images – experience that helped it analyse the built environment across the cities, identifying features such as roads, buildings, trees, water, and land.
In addition, the researchers used estimates of obesity prevalence from the 500 Cities project to create a model that assessed the association between those features (plus points of interest like gas stations, shopping malls, parks, and pet stores) and obesity prevalence in the studied areas.
It's not the first time scientists have done something like this, but the researchers say their technique is the most comprehensive effort yet.
According to their results, features of the built environment explained almost two-thirds (64.8 percent) of the variation in obesity prevalence across all census tracts studied, although the success level varied between cities (with the highest being 73.3 percent in Memphis).
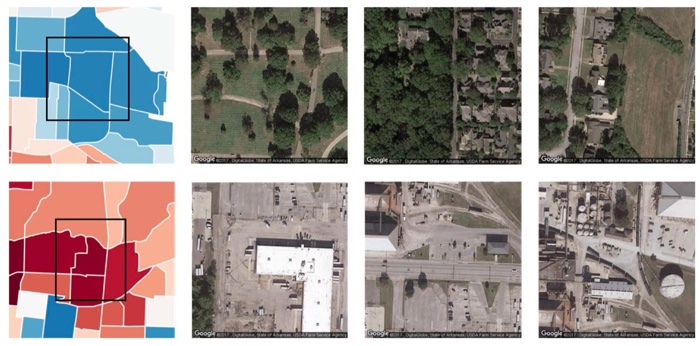 Green cover associated with low obesity prevalence in Memphis, top row. Bottom row, sparse greenery linked with high obesity (Maharana et al.)
These kind of eye-in-the-sky analyses are never perfect, but the researchers are confident their system could nonetheless offer an easy, scalable tool to help studies gauging obesity risk across the US.
"Our approach consistently presents a strong association between obesity prevalence and the built environment indicator across all four regions, despite varying city and neighbourhood values," the authors explain.
The researchers suggest socioeconomic indicators such as income are likely an important factor behind the associations found, and similar studies are already using these kind of CNNs to identify things like poverty from satellite imagery.
The research broadly supports a lot of what we already knew about the built environment's impact on obesity: open, green spaces that enable physical activity are usually good for public health; densely packed neighbourhoods hemmed in by roads and lacking greenery are not.
But the ability to tap into the immense power of machine learning to augment our existing knowledge on public health is giving us whole new ways of approaching this area of research.
"Care must be taken in not over-interpreting any results," a commentary on the research, co-authored by biostatistician Benjamin A. Goldstein from Duke University, explains.
"Even so, in the same way a biomarker may serve as a useful indicator of disease risk, these neighbourhood factors can serve as a valuable indicator of health outcomes … Going forward, it is likely that machine learning methods will be integral to discovering features associated with disease – likely features never previously suspected."
The findings are reported in JAMA Network Open.