We all know that Antarctica's ice is melting into the ocean faster than ever, but we haven't had a lot of information on how exactly that ice makes its way across the continent.
A team of scientists has now pored over decades of satellite data to change this, and have developed the most precise map of Antarctic ice velocity ever.
The researchers, from the University of California, Irvine (UCI) and NASA's Jet Propulsion Laboratory (JPL) combined data from six satellite missions from the Canadian Space Agency, the European Space Agency, and the Japan Aerospace Exploration Agency over 25 years.
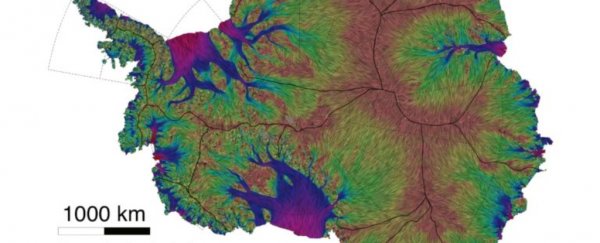
 (Jeremie Mouginot/UCI)
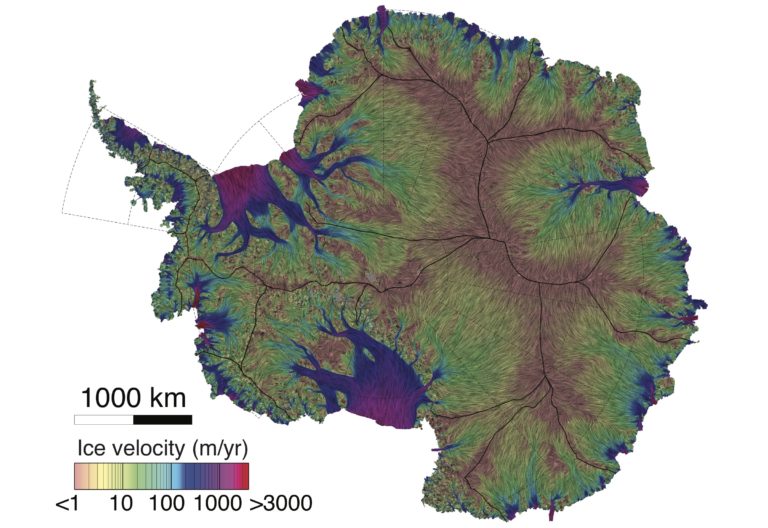
As you can see from the image, some ice (in orange) moves really slowly over the years – less than a metre per year; other ice (in pink) is raring to go and can easily advance by 3 kilometres (1.8 miles) over the course of year.
In the past, researchers would map the velocity of ice using optical images and synthetic aperture radar (SAR) data - specifically using a technique called "speckle and feature tracking".
This type of tracking detects changes in radar images - showing the small movements of ice over time. The technique is great for measuring fast-flowing ice, but not so good at the really slow stuff.
So, to get a more comprehensive picture, the team also used the interferometric phase in the SAR data.
"In contrast with speckle and feature tracking, the precision of the interferometric phase is not limited by the spatial resolution of the data (a few metres) but by the size of the radar imaging wavelength (a few centimetres)," the team explains in their paper.
This is a more precise way of measuring the ice changes, but it takes significantly more effort, especially when it comes to the amount of data you need to measure.
"The interferometric phase of SAR data measures the ice deformation signal with a precision of up to two orders of magnitude better than speckle tracking," says Earth system scientist Jeremie Mouginot from UCI.
"A drawback is that it requires a lot more data, namely multiple passes at different angles over the same point on the ground – a problem that was solved by a consortium of international space agencies pointing Earth-monitoring spacecrafts to this part of the world."
The results created a map that can see ice movement down to 20 centimetres per year for more than 70 percent of Antarctica.
The researchers are hoping that this information can help environmental scientists track things like the boundaries of glaciers, and create climate models of the entire Antarctic continent.
"It will also help in locating the most promising sites for ice core drilling to extract climate records and in examining the mass balance of Antarctica beyond its periphery," explains Earth system scientist Eric Rignot from UCI and JPL.
The research has been published in Geophysical Research Letters.