Step aside, Google Maps; stand down, Apple Maps. Researchers from the Technical University of Munich (TUM) in Germany have created a new online atlas that shows the location of 2.75 billion buildings in 3D.
It's a phenomenal technical achievement, and it was made possible by a vast database of satellite imagery and some clever machine-learning algorithms, using height data from buildings that have been measured to estimate the sizes of buildings that haven't.
The map is called the GlobalBuildingAtlas, and you can access it online now. Compared to previous databases of this type, such as the Microsoft Building Footprint database, it offers information on more than a billion extra buildings, with relatively high-resolution 3D models for almost all of the structures too.
Related: Growing Fruit And Veg In Urban Farms Isn't The Green Choice We Imagine
Now that the project is completed and online, the team behind it is hoping it can be used to inform decisions related to climate change, city infrastructure, disaster planning, and the many other areas where urbanization plays a role.
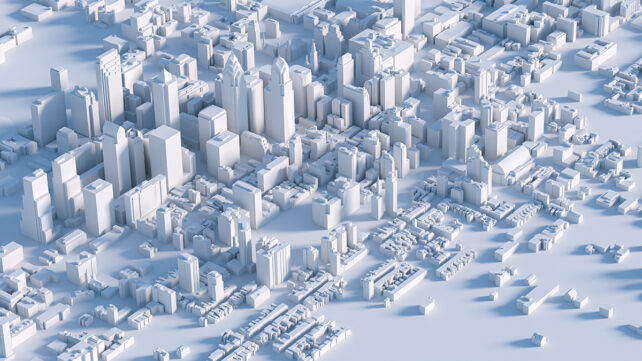
"3D building information provides a much more accurate picture of urbanization and poverty than traditional 2D maps," says Xiaoxiang Zhu, data scientist at TUM.
"With 3D models, we see not only the footprint but also the volume of each building, enabling far more precise insights into living conditions."
The atlas uses a resolution of 3-by-3 meter blocks – not enough to see finer building details, but enough to capture the size and general shape of each structure. It's 30 times finer than existing building footprint databases have managed, so it's impressive nonetheless.
That volumetric data makes a huge difference when it comes to working out population densities and how urban centers are designed.
With an increasing percentage of the world's population moving into cities, the United Nations has made developing cities that are "inclusive, safe, resilient and sustainable" one of its key Sustainable Development Goals as part of its 2030 Agenda. That's just one of the aims that this new map can help us work towards.
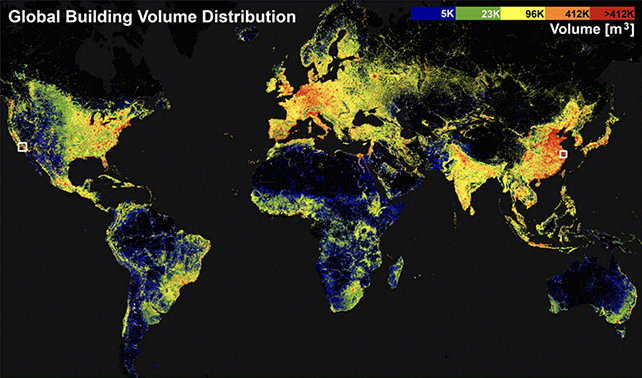
Another useful analysis approach highlighted by the researchers is measuring built-up areas by 3D volume rather than 2D coverage – a potentially more accurate way of assessing how many people live in a particular area, and therefore how many essential public services (including hospitals and schools) are going to be needed.

"We introduce a new global indicator: building volume per capita, the total building mass relative to population, a measure of housing and infrastructure that reveals social and economic disparities," says Zhu.
"This indicator supports sustainable urban development and helps cities become more inclusive and resilient."
With the involvement of machine learning AI, the 3D data isn't guaranteed to be exactly correct across the globe. The researchers acknowledge that regions in Africa require more training data and validation, while the height of high-rise buildings tends to be underestimated in general.
However, this is a much more accurate and comprehensive map of 3D buildings than we've ever had before – and there are plans to improve the quality of the data going forward, which will in turn make the atlas more useful.
"Buildings anchor human life and define the form and function of urban environments," write the researchers in their published paper.
"3D insights are essential for urban planning, infrastructure management and policy-making – especially in resource-limited contexts where the strategic allocation of funding and intervention is critical."
The research has been published in Earth System Science Data.