Two centuries ago, the governor of Massachusetts, Elbridge Gerry, approved a new and oddly-shaped voting district that was long, thin and curvy like a snake.
Pretty soon, newspapers like the Salem-Gazette began warning the public that the new map, colloquially referred to as "The Gerry-Mander", was a "monster brought forth to swallow and devour your Liberties and equal Rights."
Today, the manipulation of voting districts to favor one party or class is called gerrymandering, after Gerry's historic decision.
Most people agree that gerrymandering is a dirty attempt at giving one party or class an advantage over others. Even the Supreme Court concurs, and in 1986 it declared the practice unconstitutional.
But how exactly do courts decide which districts are purposefully gerrymandered and which are not?
The answer is more complicated than it may seem, and despite multiple court hearings, these cases have been almost entirely unsuccessful in federal court.
Now, a University of Vermont mathematician has developed a new tool which could help locate districts that are gerrymandered.
"It's called the declination," said the mathematician Greg Warrington.
"Because there is no single standard of what exactly gerrymandering is, there is no one way to test for it. But our measure is better in a lot of ways than the other approaches now being used."
Warrington's method has revealed that since 1972, the most extreme gerrymander that favored Republicans was in the 1980 election in Virginia.
On the other hand, for Democrats, it was the Texas election of 1976.
But what about more recent cases?
Warrington's tool has identified that from 2012 to 2016, Pennsylvania, Ohio and North Carolina were strongly gerrymandered for Republicans, while Maryland and California have been strongly gerrymandered for Democrats.
What exactly is declination?
Just like a compass shows the angle between magnetic north and true north, Warrington's declination reveals the difference between winning and losing a district. In a perfectly "equal" district, Democrats would win 50 percent of the vote and Republicans would win 50 percent of the vote. This is called the 50 percent threshold, and Warrington says it's what we should all be focusing on.
Let me give you an example. If a voting district has been drawn without thinking about whether it is placing a party over or under the 50 percent boundary, it would make a nice straight line. But if that line suddenly changes direction at 50 percent, Warrington says we need to "watch out."
While an abrupt turn at 50 percent doesn't necessarily mean a district has been partisan gerrymandered, it is a strong indicator.
Here's a real world example of what that looks like. When Warrington plotted out the 2014 congressional election in North Carolina, he found that the ten districts won by Republicans all seemed to hover in a flat patch somewhere between 30 and 45 percent of Democratic voters.
On the other hand, the three districts won by Democrats hovered well above 70 percent of Democratic voters.
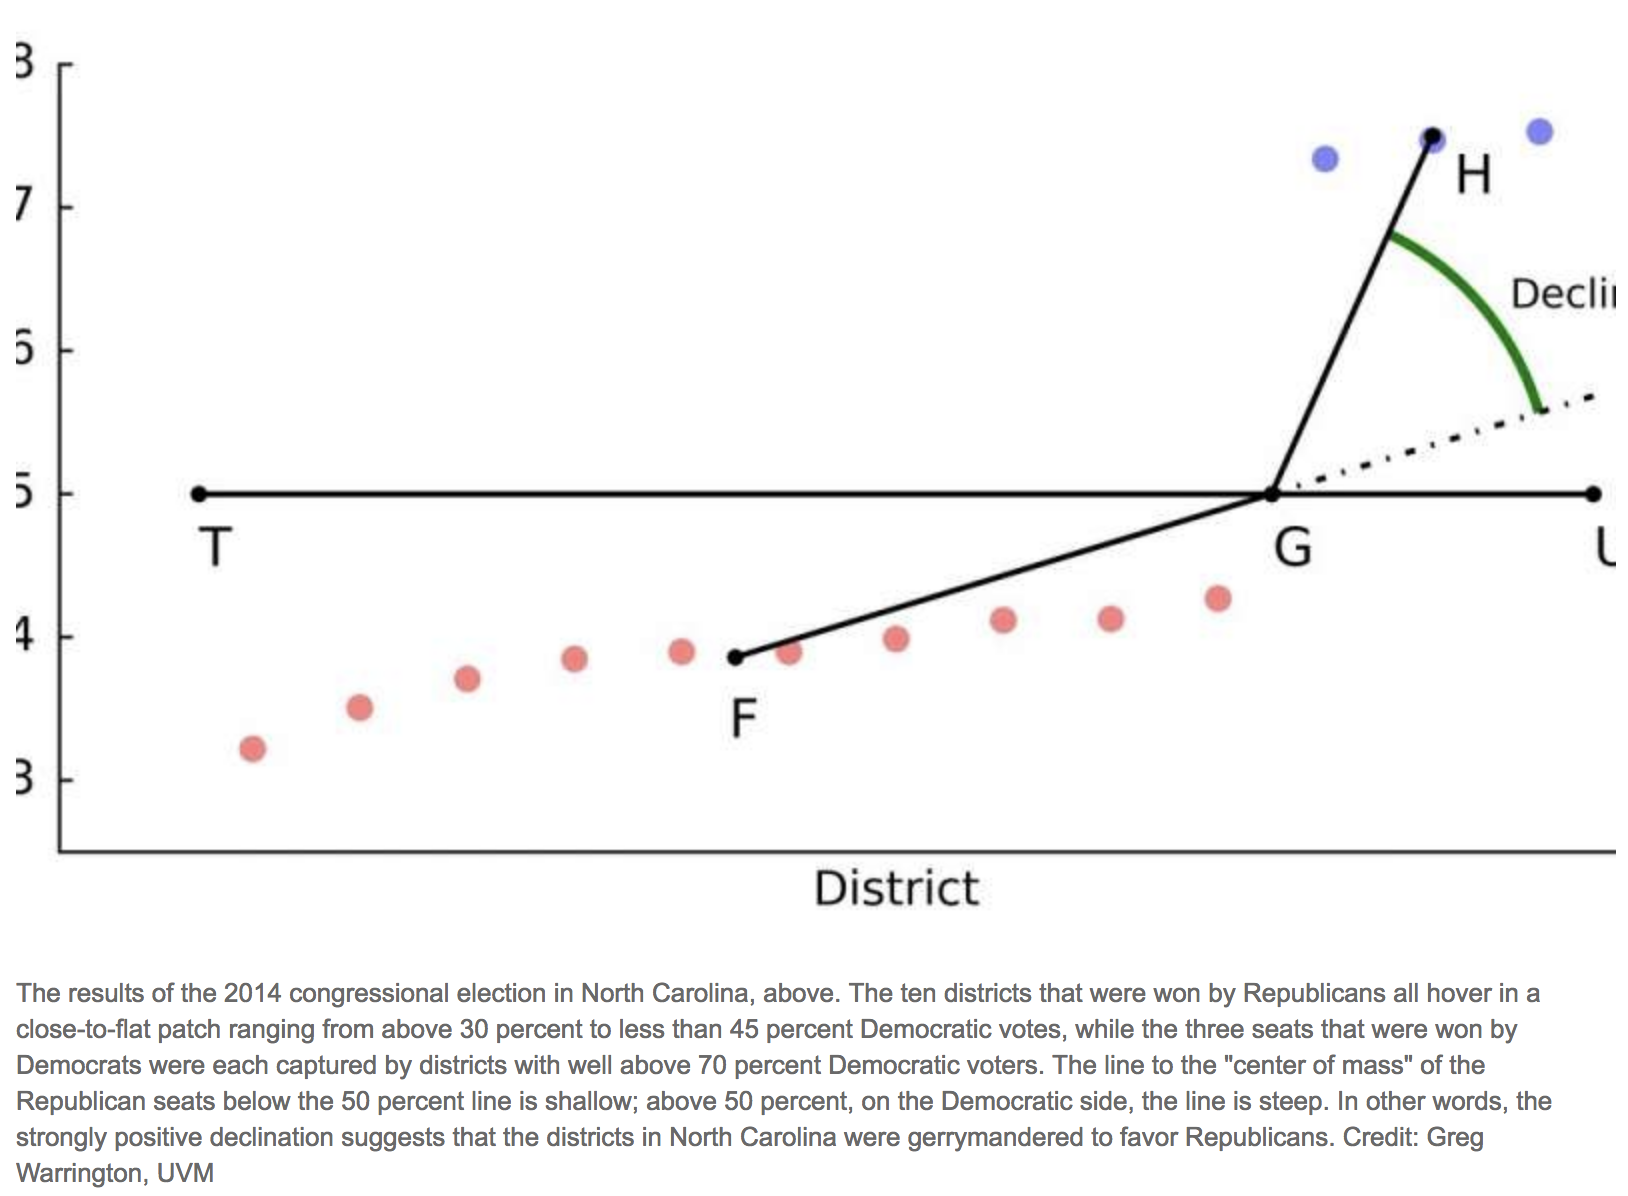
As you can see in the diagram above, the line to the "center of mass" of the Republican seats (the red dots) is relatively shallow. Whereas, the line on the Democratic side (the blue dots) is absurdly steep.
Warrington says this indicates a strong positive declination. In other words, the districts in North Carolina were gerrymandered to favor Republicans.
In the past, gerrymandered districts have been identified by their odd shapes, but Warrington says this isn't always correct and that's why his method is better.
"Just as one can be ill and yet not have a fever," Warrington explained, "so can one have a gerrymander without violating compactness."
The technique comes at a particularly important time. The Supreme Court is currently hearing gerrymandering cases for districts in Wisconsin and Maryland.
If the Supreme Court rules in June of this year that some partisan gerrymanders are unconstitutional, Warrington believes declination—in combination with measures of compactness, an assessment of the intent of those who drew the maps, and a look at the impact of the redrawn maps—could be a "manageable judicial standard" in the future.
And just like that, the Supreme Court could completely re-draw American life.
The study was published in Election Law Journal.