NASA has released a global map of the Earth at night for the first time since 2012, using the powerful Suomi NPP satellite and complex computer algorithms to give us our best look yet at our planet in darkness.
The newly improved, high-resolution graphics can help scientists plot population patterns, energy demand, the expansion of cities, and even shipping lanes.
What's more, NASA scientists plan to release daily snapshots of the world at night later this year, so we don't have to wait five years between updates - and that means researchers would be able to use the data to aid disaster recovery operations and monitor energy use on a day-to-day basis.
At the heart of the Suomi NPP satellite is the Visible Infrared Imaging Radiometer Suite or VIIRS, which can capture night-time shots at an unprecedented resolution, and is able to detect photons of light in 22 different wavelengths.
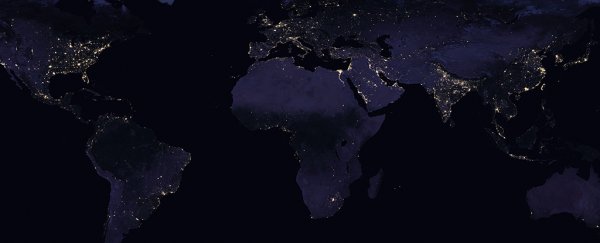
On the Europe image, you can see the snow-capped mountains of Norway
 NASA Earth Observatory
By putting these images through software designed to intelligently remove clouds, moonlight, and seasonal vegetation, scientists have been able to produce images significantly better than those we saw in 2012.
With more tweaking, VIIRS will soon be able to identify individual boats and street lamps.
"Thanks to VIIRS, we can now monitor short-term changes caused by disturbances in power delivery, such as conflict, storms, earthquakes and brownouts," says one of NASA's research team, Miguel Román from the Goddard Space Flight Centre.
"We can monitor cyclical changes driven by re-occurring human activities such as holiday lighting and seasonal migrations. We can also monitor gradual changes driven by urbanisation, out-migration, economic changes, and electrification."
The Suomi NPP satellite can observe just about every location on Earth twice a day, taking strips that are 3,000 kilometres (1,865 miles) long.
The special 'day-night' band built into VIIRs allows it to distinguish night lights with six times better spatial resolution and 250 times better resolution of lighting levels than older satellites.
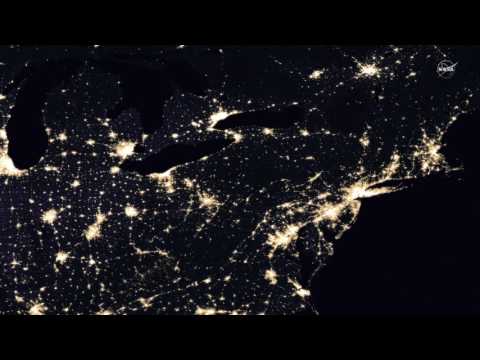
You can see the US urban sprawl, though mining operations still shine bright in rural areas:
 NASA Earth Observatory
Here, urban settlements follow the Nile in Egypt:
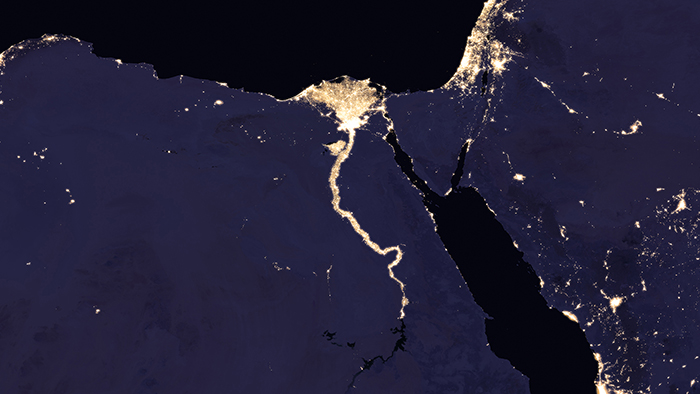 NASA Earth Observatory
And the best part is, scientists can get their hands on the data within minutes, thanks to the partnership between NASA and the National Oceanic and Atmospheric Administration (NOAA) on this project.
Head to the NASA site and you can compare some of the shots from 2012 with the versions taken in 2016: you can see the growth of cities in India, and even the development of a single highway to the west of Chicago.
NASA has even released whole hemisphere photos too, like this one of Asia and Australia. Oh, Earth, you're looking good:
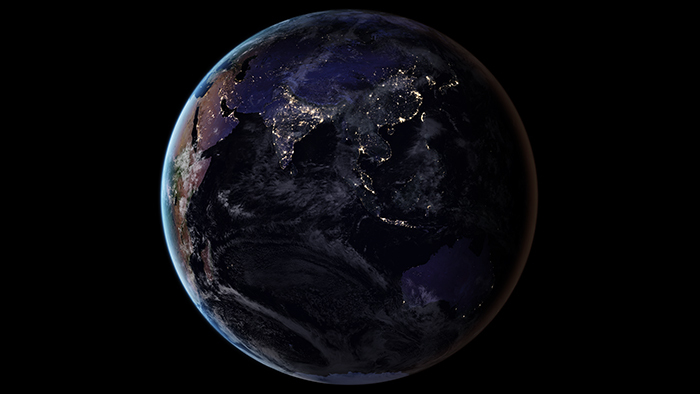 NASA Earth Observatory
Once the daily updates are ready to go, NASA hopes they can be used for tracking sea ice, monitoring unregulated fishing, assessing the impact of war on power grids, reducing light pollution, and more.
With such a high-resolution image available, the data will even be useful for urban planning and local government use – in times of a power outage, perhaps.
"The fact that we can track all these different aspects at the heart of what defines a city is simply mind-boggling," says Román.
You can see a video outlining the new technology below: