For the past two decades, NASA has continuously kept an eye on our planet's biosphere as it pulses and ebbs with the seasons.
The data is invaluable to researchers, but the time-lapse imagery also provides us with a breathtaking visualisation of Earth's most unique characteristic – life.
The Sea-viewing Wide Field-of-view Sensor (SeaWiFS) was launched in 1997, and spent the next 13 years looking down on us from its orbit 700 kilometres (about 435 miles) overhead.
The satellite's purpose was to collect data on the bio-optical properties of our planet's land masses and oceans. As it did so, it watched Earth's living colours change with the seasons.
The SeaWiFS wasn't the first sensor to collect optical information on our planet's biosphere, with the Landsat program commencing their imaging work in the early 70s.
It's also far from the last, as an increasing variety of digital technologies are sent into orbit to map the light bouncing back in ever finer resolutions.
For researchers, long-term trends help provide a glimpse of things to come in the near future. Satellite data from such programs is used to monitor the health of crops, forests, and fisheries around the world year by year, helping to improve models and forecast disasters.
The rest of us can appreciate the sheer beauty of our globe as our planet seems to almost breathe.
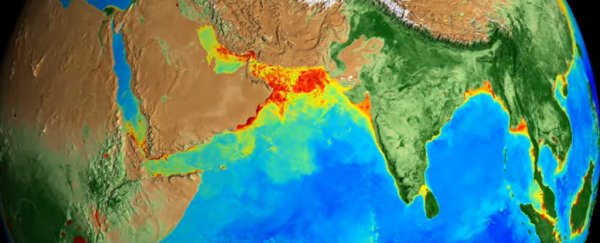
Just take a look at the image below to get a sense of Earth's living pulse, as the white of the ice advances and retreats, the purple tones indicating sparse levels of phytoplankton, and the fading and darkening greens reflecting plant growth and algal blooms.
 (NASA)
This stunning animation was made using data from the SeaWiFS and NASA's Terra, Aqua, and Suomi National Polar-orbiting Partnership weather satellites.
"That's the Earth, that is it breathing every single day, changing with the seasons, responding to the Sun, to the changing winds, ocean currents and temperatures," says Gene Carl Feldman, an oceanographer at NASA's Goddard Space Flight Centre.
Technology is reaching the point where sensors can pick up finer details at wavelengths that can reveal what's going on at a chemical level.
For example, specific changes in the light reflected from plants can highlight the moments photosynthesis is converting carbon dioxide and water into sugars.
Several years ago, NASA used this method to investigate the productivity of corn crops in the US Midwest.
"It was kind of a revelation that yes, you can measure it," says NASA researcher Joanna Joiner.
Referring to the corn, she adds, "Those plants have some of the highest fluorescence rates on Earth at their peak."
With such a vast catalogue of images dating back nearly half a century, NASA researchers can get a clear idea of the kinds of changes that take time to emerge.
"As the satellite archive expands, you see more and more dynamics emerging," says Jeffrey Masek, chief of the Biospheric Sciences Laboratory at NASA Goddard.
Watch the video below to learn how a history of watching our planet informs scientific research:
