On 16 July 1945, Trinity – the first nuclear explosion ever – was conducted by the US Army in the Jornada del Muerto desert, New Mexico. This successful, experimental trial – resulting in the detonation of a spherical bomb nicknamed 'The Gadget' – ushered in a new nuclear age and arms race, with several nations subsequently developing and detonating their own nuclear weaponry in the decades since.
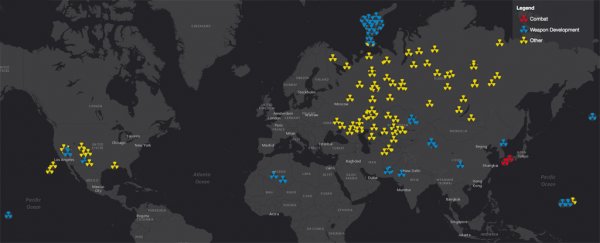
Now, all those explosions can be viewed in a stunning new interactive online map that charts every known nuclear detonation since 1945 up until this year.
Produced by British mapping firm Esri UK, that's some 2,000+ detonations in total, with nuclear testing spanning much of the globe in the intervening decades since the culmination of the Manhattan Project.
To navigate the map, click here. Once the content has loaded, you can zoom in and zoom out, and pan laterally between countries. A progress bar along the bottom of the screen shows the timeline from 1945 to present day. If you click on individual detonations you get contextual pop-ups, including web links to more information where available.
If you hit play on the progress bar, the map animates, showing new nuclear detonations as they occur each year. Things get particularly hectic during the '60s and '70s, before slowing down in more recent decades thanks to nuclear limitation and non-proliferation treaties.
It's not entirely clear how many detonations in total are included in the map's data set, although according to Matt Broomfield at The Independent, some 2,624 nuclear explosions are depicted. Wikipedia's entry on the topic puts the count at 2,120 known tests and 2,475 devices fired.
In any case, there's been an awful lot of destructive power (and enduring radiation) unleashed in the history of nuclear detonations, with the majority being conducted by the US, the former USSR, and France.
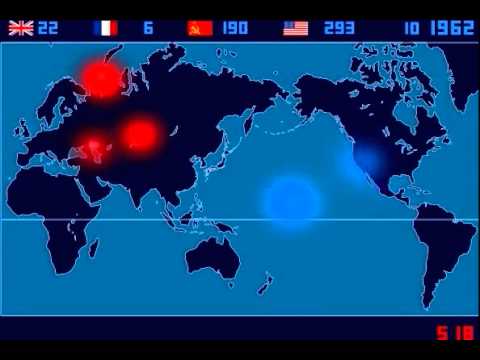
It's not the first time we've seen the history of nuclear testing visualised like this, although the interactive elements in Esri UK's map are a great touch if you want to delve deeper. We've embedded two non-interactive animations below charting similar territory.
The first, created by Japanese multimedia artist Isao Hashimoto, shows nuclear detonations between 1945 and 1998, while a more recent effort by Canadian musicians Orbital Mechanics runs up until 2010.